Using the Reports window
The Reports window displays a summary of all reports currently defined for a survey. A report consists of a list of instructions that tell the report what text, graphics and analyses are used in the report and how to lay them out.
To open the Reports window, click
![]() on the toolbar, press Ctrl+H or select Reports from the View menu.
on the toolbar, press Ctrl+H or select Reports from the View menu.
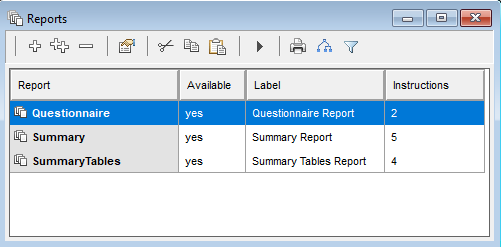
Report | A unique ID for the report. This can be any name used to identify it |
Available | Whether the report will be visible once the survey has been published (this allows you to set which reports people can see) |
Label | A brief description of the report, seen when online. |
Instructions | The number of separate instructions in the report |
Toolbar buttons
Button | Menu Option | Alternative | Description |

| Edit | New | Ctrl + N | Create a new report. |

| Edit | Clone | Ctrl + O | Clone/copy an existing report to create a new report. |

| Edit | Delete | Delete | Delete an existing report. |

|
| View details of an individual report. | |

| Edit | Cut | Ctrl + X | Delete report and place data on the clipboard. |

| Edit | Copy | Ctrl + C | Copy report and place data on the clipboard. |

| Edit | Paste | Ctrl + V | Create report from data held on the clipboard. |

| Edit | Run |
| Execute (run) or check the current report. |

| File | Print Report | Ctrl + P | Produce a report on the contents of the Reports window. |

| View|Sources and Dependents |
| Open the Sources/Dependents dialog to show what variables, reports and analyses are required by the selected report and which other reports require the selected report. |

|
|
| Open the Define external filters and contexts dialog |
Report definition
The Report definition dialog is used to define the instructions in a report and the data the report will run on. A report is built up from a series of instructions that can then be executed, in full or in part, to create the report.
Name | Enter a unique name for the report consisting of a letter followed by up to fifteen letters or digits. Snap generates a default name beginning RP. |
Display Name | This shows how the report name will be displayed on Snap Online. |
Instructions | The number of instructions in the report. |
Label | Enter a description of the report. For example “Analysis of all questions by Age”, “Analysis of all questions: January to June”. |
Context | Set the context the report will be generated for in Snap. Enter the name of a variable or a context data set to produce a report for each possible code value of the variable or combination of values in the set. Leave blank to use the current global context. |
Filter | Enter a filter expression for the case data used in the report for example, to produce analysis for a particular month or region. Leave blank to use all cases. Enter a variable name to produce a set of reports filtered on each possible value code of the variable. |
Available | Specify the conditions in which the report will be visible in Snap Online. Leave empty to always provide the report. |
Add Index | Set to On to add an index of all the analyses on the last page of the report. |
Skip Empty | Set to On to omit any instruction for which there is no data (e.g. an empty chart). |
Instruction list | A summary of the instructions in the report, giving their sequence number, their type, and a descriptive title entered when the instruction was created. |