Using the Analysis Definition Dialog
The Analysis Definition dialog contains all the information and settings used to create the analysis.
There are seven tabs that are available in the Analysis Definition dialog.
- Definition defines the name and style of the analysis (table, chart, cloud, list or map) and the data analysed.
- Notes/Titles define the titles and notes that appear on the analysis.
- Base/Labels define the base used for the analysis and set templates for the labels.
- Report Styles defines the titles and descriptions that are included in the report and select the horizontal alignment.
- Cells define how the data appears in the table cells.
- Auto Coding defines how to automatically generate variables for analyses that are built from open response questions.
- Summary Statistics define the advanced statistics that are displayed in the analysis.
- Descriptive Statistics define the descriptive statistics for numeric and quantity data that are displayed in the analysis.
The tabs that are displayed depend on the settings.
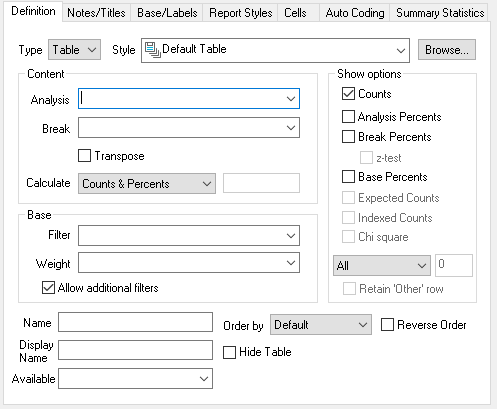
Definition tab
| Area | Description |
| Type | Specifies the analysis as a table, chart, list, cloud or map. |
| Style | Selects the style template appropriate to the defined type. |
| Content | |
Analysis | Specifies one axis for the data to be analysed (normally the rows of a table). This can contain:
|
Break | Specifies the other axis used to split the data into subgroups. This can contain:
Pre-defined tables such as Statistics table, Grid table, Holecount table |
Transpose | Switch the positions of Analysis and Break |
Calculate | Specifies the type of analysis together with a field specifying the analysis data. There are six Calculate values.
The variable entered in the Calculate box adjacent to the Calculate list box is used to calculate the means and sums. |
| Base | If no Base is specified then all respondents in the survey will be included in the analysis. |
| Filter | Defines the subset of data to analyse given as a logical expression. |
Weight | Defines how to alter the calculation to represent a different group of respondents. This can be
|
Allow additional filters | Permits other filters to be applied to this analysis when used in reports. Clear this option if you always want this analysis to appear exactly as defined. |
Show Options | The options available depend on the type of analysis selected in Content and Calculate. |
All | Show all rows or columns in table or equivalent in chart |
Top rows (or columns) | Display following number of rows (or columns) from start of table |
Bottom rows (or columns) | Display following number of rows (or columns) to end of table |
Rows (or columns) above | Display number of rows (or columns) above a specified value |
Rows (or columns) below | Display number of rows (or columns) below a specified value |
Retain ‘Other’ row (or column) | Creates ”Other’ category if rows (or columns) are limited |
Order by | Defines the order in which the analysis data appears
|
| Reverse Order | Select the check box to reverse the selected order |
| Hide Table | Select the check box to hide the analysis display in a report so that only the notes are visible |
| Name | A name by which each analysis can be saved for later recall/reference |
| Display Name | The name that will be used for the analysis when displayed in Snap Online. |
| Available | Enter a condition under which the analysis is visible in Snap Online. Set to No to make the analysis unavailable and leave blank for it to be available. |
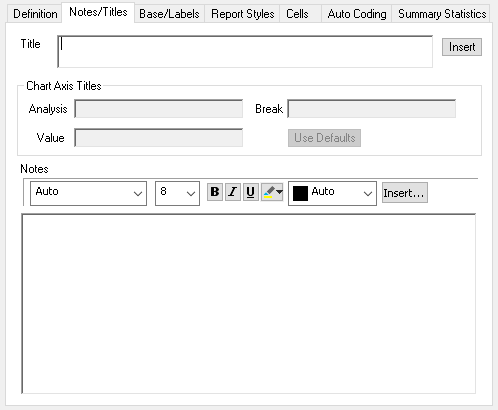
Notes/Titles tab
| Area | Description |
| Title | Defines the title for table window and text report. This defaults to a summary of the analysis. |
| Insert | Insert an Image, Variable field, Survey field, Date/Time field, HTML field, Analysis field or Cell value field at the current cursor position. |
| Chart Axis titles | Specify the titles for the chart axes |
| Analysis | Defaults to the analysis definition as title |
| Break | Title for the x-axis (not for pies or doughnuts) Defaults to the break definition |
| Value | Title for the y-axis (not for pies or doughnuts) |
| Use Defaults | Set the chart axis titles back to the default values. |
| Text style area | Specifies the font typeface, size, colour and formatting used in notes. |
| Insert | Insert an Image, Variable field, Survey field, Date/Time field, HTML field, Analysis field or Cell value field at the current cursor position.the note |
| Notes panel | Enter text for more information about the current analysis. Text entered here can be viewed and edited in a text panel below the window displaying the result (visible by clicking |
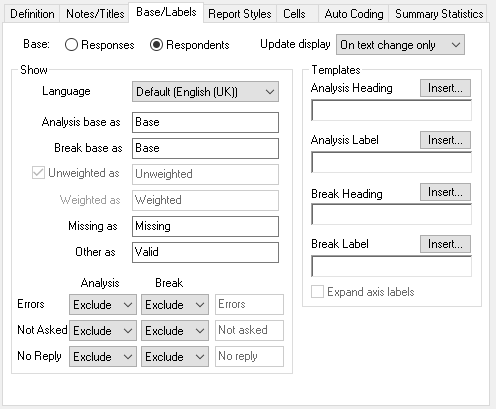
Base/Labels tab
| Area | Description |
| Base |
|
Update Display | Define when the analysis view is updated
|
| Show | |
| Language | Select the survey language for any labels and analysis fields. This defaults to the system language. When there is no text defined in survey for that language, text will not be displayed. |
| Analysis base as | Enter text for label in field. |
| Break base as | Enter text for label for base section in field |
| Unweighted as | Select or clear the check box to display the unweighted and weighted break bases separately. This is only available if a weight is applied. Enter text for label in field. |
| Weighted as | Enter text for label in field. |
| Missing as | Title for the group of No Reply, Not Asked and Errors. Automatically included if any of these included |
| Other as | Group heading for quantity variables |
| Errors Not asked No reply | You can choose whether non-valid responses are included in the calculations for the analysis and break values. You can also choose whether to display a line of information about these responses
|
Templates | Use Insert to insert one of
|
Analysis Heading | Title for analysis group of rows. Defaults to the variable label (analysis question grid label). |
Analysis Label | Title for analysis rows. Defaults to the analysis question code label. |
Break Heading | Title for break group of columns. Defaults to the variable label (break question grid label) |
Break Label | Title for break columns. Defaults to the break question code label. |
Expand axis labels | If multiple variables are used, provide separate labels for each of the variables that appear on one axis. (Charts only). You can define the content of these labels in the Analysis and Break Heading and Label template fields. |
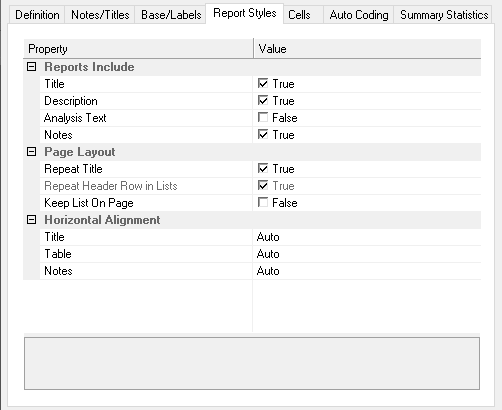
Report Styles
Area | Description |
Reports Include | |
Description | Include the detailed description defined in the Results Report dialog when you print an analysis from an analysis window |
Notes | Include the notes entered in the Notes tab |
Analysis text | Include the question text of the Analysis expression |
Title | Include the title text entered in the Notes tab |
Cells
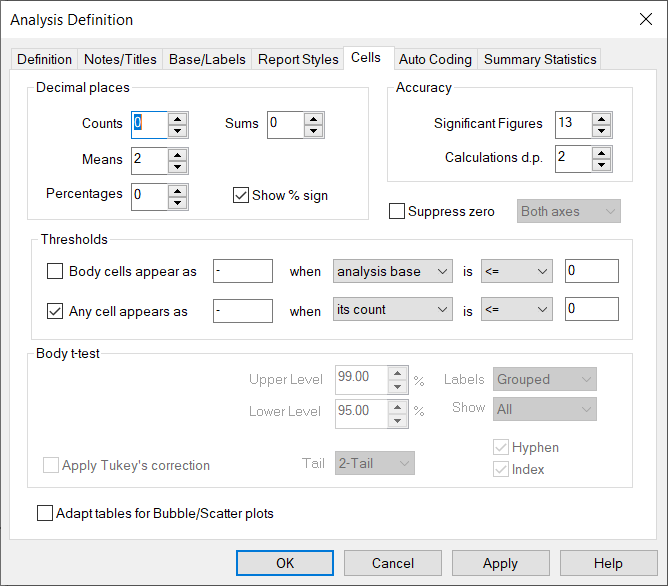
Area | Description |
Decimal places | Specify the number of decimal places shown on the following values |
Counts | Defaults to 0 |
Means | Defaults to 0 |
Percentages | Defaults to 0 |
Sums | Defaults to 0 |
Show % sign | Select or clear the check box to display percentage sign. Defaults to on |
Accuracy | |
Significant figures | Maximm number of significant figures. Defaults to 13 (including decimal places). If calculations exceed this number, the word OVERFLOW is shown. |
Calculations d.p | The number of decimal places used in the calculations. Defaults to 2. |
Suppress zeroes on specified axis | Remove rows and/or columns (as specified) in a table or chart where all responses are 0. (If you still wish to use them in confidence calculations, you will need to clear the Ordered values box on the Summary statistics tab) |
| Thresholds | |
Body cells appear as when is | Check box to specify the conditions under which an entire row or column is suppressed and the character to be used to replace the values field |
Any cell appears as | Check box to specify the conditions under which any individual cell in the table is suppressed. The default setting is to replace all zero (or less) values with a hyphen (-) |
Body t-test/Body z-test | Displays t-test for Means and Significances analysis selected on the Definition tab and z-test if z-test is checked on the Definition tab for Counts and Percents. |
Upper Level | Upper significance level |
Lower Level | Lower significance level |
Labels | Select Grouped or Continuous to choose how multiple break variables will be labelled |
Show | Select which column the significance levels will be displayed in: All: All columns where they apply Lower: Only show the columns with the lower significance level Right: Only show the right-most column containing the significance level |
| Apply Tukeys correction | Check to apply correction to the t-test formula which takes account of carrying out multiple t-tests (t-test only) |
| Apply Yates correction | Check to apply correction to the z-test formula which increases the precision of the test (z-test only) |
| Tail | Select two-tailed test when looking for a difference between two mean scores Select one-tailed test when looking for an increase or a decrease between results |
| Hyphen | Check to display hyphens for non-significant results |
| Index | Check to label columns with the letter used as an index |
Auto Coding
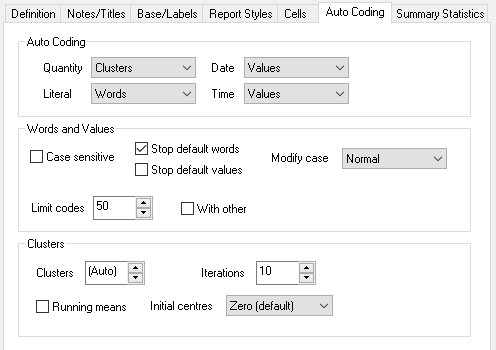
| Area | Description |
| Auto Coding | |
| Quantity | Set to None for no auto coding Set to Clusters to auto categorise the data using a k-means cluster analysis Set to Values to sort the quantity responses into code bands with one code per unique value |
|
Literal |
Set to None for no auto coding Set to Values to create a code for each unique response (so “I like apples” and “I love apples” would have different codes.) Set to Words to create a code for each unique word in a response (so “I like apples” and “I love apples” would have four codes, one each for “I”, “like”, “love” and “apples”) |
|
Date |
Set to None for no auto coding Set to Values to sort date responses into code bands with one code per unique value |
|
Time |
Set to None for no auto coding Set to Values to sort time responses into code bands with one code per unique value |
|
Words and Values |
|
|
Case sensitive |
Create separate codes if responses use different cases. |
|
Stop default words |
Do not code words that are included in the stop list |
|
Stop default values |
Do not code values that are included in the stop list |
|
Modify case |
Change the case of words or phrases to the selected style |
|
Limit codes |
Set the maximum number of codes to be used (maximum number of 2000) |
|
Clusters |
Specify how open-response quantities will be coded into clusters |
|
Clusters |
Set the number of clusters to create |
|
Iterations |
Set how often the algorithm is repeated (higher numbers give greater accuracy but are slower) |
|
Running means |
Check to calculate the cluster centres every time a data case is allocated to a new cluster, rather than waiting until all cases have been evaluated. |
|
Initial Centres |
Specify the starting point of the calculations |
|
|
Set to Zero (default) to start at 0 (in the n-dimensional space). Since the data has been standardised, this should be the centre point of all the variable data |
|
|
Set to First case to use the data in the first respondent case as the starting point |
|
|
Set to Evenly spread to spread the start points evenly across the n-dimensional space |
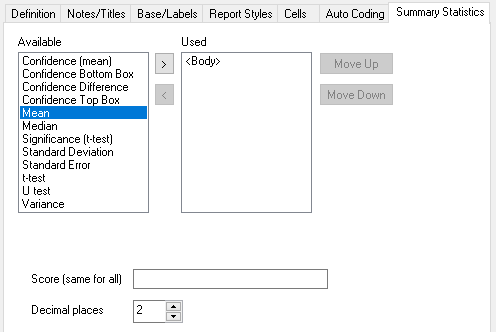
Summary Statistics
|
Area |
Description |
|
Available |
List of statistical data you can add to your chart/table |
|
Used |
List of statistical data you have added to your chart/table |
|
Statistical data |
|
|
<Body> |
The analysis/break information given in definition |
|
Confidence (mean) |
Specify the confidence level and display the confidence interval level for the mean (using the defined scoring system) |
|
Confidence Bottom Box |
Specify a low-end group of values to be calculated and displayed. If confidence interval selected as an option, display the level of confidence that sample matches target population. |
|
Confidence Difference |
Display (top box percentage total) – (bottom box percentage total) |
|
Confidence Top Box |
Specify a high-end group of values to be calculated and displayed. If confidence interval selected as an option, display the level of confidence that sample matches target population. |
|
Mean |
Average value of the analysis variable(total divided by base) using the defined scoring system |
|
Median |
Central value (equal number of cases to each side |
|
Significance (t-test) |
Compare mean scores of columns with mean scores of the base to distinguish whether or not the difference between the groups’ averages would most likely reflect a “real” difference in the population from which the groups were sampled. The significance is shown as a percentage. |
|
Standard Deviation |
Display standard deviation (measure of dispersal of values and hence deviation from mean) |
|
Standard Error |
Display standard error (indication of how far individual scores deviate from the mean score) |
|
t-test |
Compare mean scores of axis-defined groups to see if difference is significant. Display significance letters by column values |
|
U test |
Compare median scores of axis-defined groups to see if difference is significant. Display significance letters by column values |
|
Variance |
Display variance (measure of dispersion of values in a distribution) |
This table shows the meaning of the options which appear when a given statistic is selected. These options specify how the statistic is calculated and displayed. The default options are set in the Analysis tailoring dialog.
|
Statistic |
Option |
Meaning |
|
Mean Standard Error Standard Deviation Variance Median |
Score |
Name of weight matrix, calculation, or name of variable to apply |
|
|
Decimal places |
Number of decimal places used in calculation |
|
Confidence (mean) |
Confidence Level |
The level of certainty that the answer lies within the range given |
|
Confidence Top Box Confidence Bottom Box |
Use the x y responses out of z to calculate q |
Select the range of responses used to calculate the confidence top or bottom box. These will be the high-end responses for the top box and the low-end responses for the bottom box |
|
|
Ordered values |
Check to only use displayed (ordered) values in calculation and omit any suppressed zero values |
|
|
at a confidence level of |
(gap between sample and population) at the specified confidence level |
|
|
Show confidence intervals |
Check to display the confidence interval results |
|
|
z-test |
Check to display the z-test results with the confidence intervals |
|
|
Multiplier |
Allows you to modify the confidence interval if the sample is weighted or drawn from a small (or finite ) population. Set to sqrt(1-n/N) where n = sample size and N = population |
|
Significance (t-test) |
Comparison |
Base used when comparing the mean of base to the mean of each category on your table. Either use: Base: the mean for all respondents Base less current: the mean for respondents that are not included in the category being compared. |
|
|
Score |
Name of weight matrix, calculation, or name of variable to apply (same as that used for Mean, Standard Error, Standard Deviation, Variance, Median) |
|
|
Decimal places |
Number of decimal places used in calculation |
|
t-test U test |
Upper Level |
Set the upper significance level |
|
|
Lower Level |
Set the lower significance level |
|
|
Labels: Grouped |
Specify how the figures are shown for tables with more than one break variable |
|
|
Show: All |
Select whether result is shown in both columns it affects, or whether it is only shown in one column. The column it is shown in may be: column with the higher/lower value column in the left-most/right-most position |
|
|
Show: Hyphen |
Check to show hyphens for non-significant results Check to label columns with the letter used as index |
|
|
1-Tail |
Select type of test (crudely, 1-tailed when looking for increase/decrease between results;2-tailed when looking for difference between two mean scores) |
|
|
Apply Tukey’s Correction (t-test only) |
Apply Tukey’s Honestly Significant Difference (HSD) correction to take account of carrying out multiple t-tests |
|
|
Results exclude the x y codes (U test only) |
Enables you to exclude codes (eg, Don’t Know ) from the calculation |
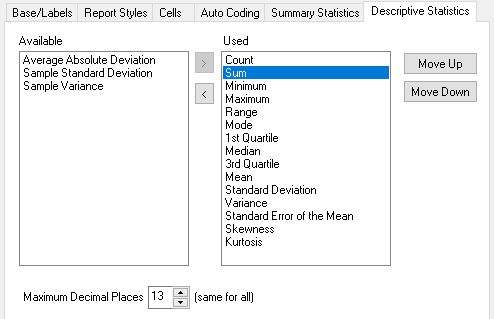
Descriptive Statistics
|
Statistic |
Description |
|
Count |
The number of data cases |
|
Mean |
This is often called the average. It is defined as the sum of the items divided by the number of items. For example, for ten responses Mean = (1 + 2 + 3 + 4 + 3 + 4 + 5 + 4 + 6 + 2) = 34 10 = 3.4 |
|
Mode |
The mode of a distribution is the most frequent or most popular item. If two values tie for the mode, Snap chooses the lower. With the same ten responses: 1, 2, 2, 3, 3, 4, 4, 4, 5, 6 Mode = 4, since 4 is the most frequently occurring value (three occurrences). |
|
Quartile 1 |
25% through a range of values |
|
Median |
The midpoint or 50% through a range of values. To calculate the median, the items of the distribution are arranged in order of magnitude starting with either the smallest or the largest, then: if the number of items is odd, the median is the value of the middle item. if the number of items is even, the median is the mean of the two middle items. 1, 2, 2, 3, 3, 4, 4, 4, 5, 6 Median = (3 + 4) ÷ 2 = 3.5 |
|
Quartile 3 |
75% through a range of values. |
|
Sum |
The sum is calculated by adding all the values of a distribution. Sum = 1 + 2 + 3 + 4 + 3 + 4 + 5 + 4 + 6 + 2 = 34 |
|
Minimum |
The minimum is the smallest value of the distribution. Minimum = 1 |
|
Maximum |
The maximum is the largest value of the distribution. Maximum = 6 |
|
Range |
The range shows the spread of the distribution and is calculated by subtracting the smallest value (minimum) from the largest value (maximum). Range = 6 – 1 = 5 |
|
Standard Deviation |
The standard deviation is a measure of dispersion of values in a distribution. It gives an indication of how much the values deviate from the mean. Thus, a distribution with a large range would have a larger standard deviation than one with a small range. The standard deviation is calculated as:  where xi is each value in the distribution, Standard Deviation = 1.428286 |
|
Variance |
The variance is another measure of dispersion of values in a distribution and is used in the calculation of the standard deviation: Snap calculates the standard deviation and variance by assuming the data represents a sample rather than an entire population. |
|
Standard Error of the Mean |
The standard error of the mean is calculated by dividing the standard deviation by the square root of the number of items in the sample. It is defined as the standard deviation of the distribution of the sample mean and gives an indication of how far individual scores deviate from the mean score shown. The larger the sample, and/or the closer the individual scores are to the mean score, the smaller the standard error. Standard Error of the Mean = 1.428286 ÷ √10 = 0.451664 |
|
Skewness |
A distribution that is not symmetrical but has more cases toward one end of the distribution than the other is called skewed. The measures of central tendency (mean, mode and median) can vary considerably. If the mean is larger than the mid point of the range (the median) and the most frequently occurring value (the mode), the sample is said to be positively skewed. If the mean is smaller than the mid point of the range (the median) and the most frequently occurring value (the mode), the sample is said to be negatively skewed. A small skewness value (close to 0) indicates that the data is evenly distributed about the mean. With this type of distribution it would be expected that the values for mean, mode and median be similar. The skewness of the example is 0.098843 indicating a small positive skewness. |
|
Kurtosis |
Kurtosis also gives an indication of the shape of a distribution in the form of the extent to which, for a given standard deviation, the data clusters around a central point. A positive value for kurtosis indicates a distribution that is more peaked than usual. A distribution of this type would typically have most of the values clustered around a central point. A negative value for kurtosis indicates a flatter or more widely dispersed distribution. The kurtosis for the example is -0.75202 |
|
Average Absolute Deviation |
The average of the absolute deviations. It is a and tends to ignore distant outliers. It is a summary statistic of statistical dispersion and would normally only be displayed if specifically requested |
|
Sample Standard Deviation |
An estimate of the population standard deviation based on the sample. |
|
Sample Variance |
An estimate of the population variance based on the sample. |