Using t-tests in tables
The t-test is used to compare two mean scores to see if the difference between them is statistically significant.
A table is set up with mean scores applied. The level of confidence between the mean scores for two different groupings can then be displayed by using a t-test.
For example, in the Crocodile Rock Cafe survey it might be required to see ratings for the overall performance of the restaurant question by age groups and to show the mean score for each of these groupings. The t-test can then be used to establish which mean scores are significantly different. For example, under 18s’ rating of overall performance is high; therefore, it would be useful to find out if this is a significant result and likely to be repeated in further surveys or just a chance thing.
-
Click
 to open the Analysis Definition dialog to build a table.
- Specify the Analysis variable for the table as Attitude (the derived variable we set up to assess Overall rating of performance).
- Specify the Break variable for the table as Q11 (Age).
- Click the Summary Statistics tab
- Double-click Mean in the Available column to move it to the Used column.
- Enter score10 in the Score field. Instructions on creating the weight score10 are given in Calculating mean scores after banding a quantity variable
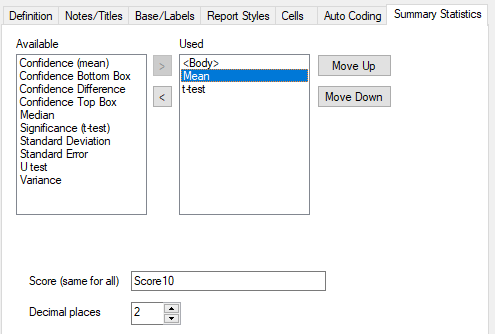
- Double-click t-test in the Available column to move it into the Used column. Leave the t-test settings as they are.
- Click on the Base/Labels tab. Because the analysis variable has been scored, change the analysis labels to make this obvious on the table.
- Click Insert by the Analysis Label and select {label}. This inserts the appropriate code label of the analysis variable into the table.
- Type “scored as” into the Analysis Label field
- Click Insert by the Analysis Label and select {score}. This inserts the score for that code into the table.
- Click OK to build the table.
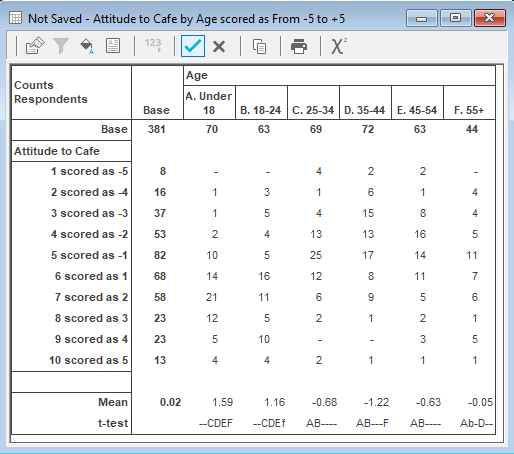
Each cell in the table shows the number of respondents who ticked each particular age group and overall performance rating. The mean displays seven scores at the bottom of the table, which indicate the mean response for the base and for each age group. The mean score was set up so that good scores are positive and bad scores are negatives. (Excellent scores 5 through to Very Poor scoring -5). The Under 18 age group, showing a mean score of 1.98, indicates that they scored overall performance of the restaurant as good. The 55+ age group has the lowest mean score of -2.5 which represents an average score of poor.
The t-test result displays 6 characters in each age group column representing the results of comparing the mean score value of one column with those of each other column. It indicates whether there is a significant result between the two means or whether it is just a chance result. For example, is it just chance that the under 18s scored highly compared to the 55+ or is this highly significant and will be a repeatable trend?
Character | Meaning |
– | No significant difference; a chance result. |
lower case character | The difference is significant at the lower level of confidence. |
upper case character | The difference is significant at the higher level of confidence. |
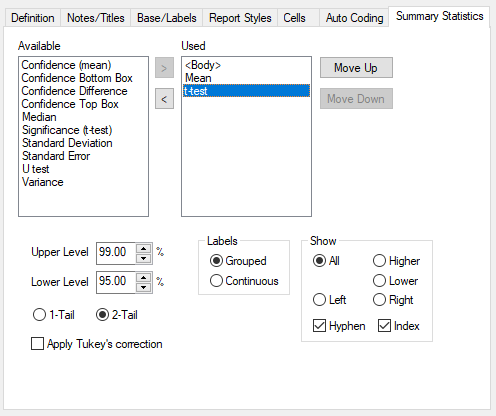
These levels of confidence can be changed on the Summary Statistics tab of the Analysis Definition dialog. Highlight t-test and alter the numbers in the Upper Level and Lower Level dialog boxes. A 99% level of confidence means that 99 times out of 100 this group of people will always score more highly. The 100 represents 100 surveys. With this level of confidence it is highly likely that the result is repeatable and not a random result.
In the example table the “under 18” t-test result displays “-bCDEF”.
- The first character place refers to itself (under 18s) and is represented with a hyphen; no significant difference is always recorded when comparing with itself.
- The second character place displays a lower case ‘b’ indicating that the result is significant at 95% confidence between the under 18s and the 18-24s.
- Character three place has a ‘C’ recorded which represents 25-34s and indicates a significant result. This result shows 99% confidence that the Under 18 age group will be more satisfied with the overall performance than the 25 to 34 age group. This result can also be seen with the next two age groups as capitals are displayed for D, E and F.
Although the t-test is a reliable statistical method that allows you to analyse any major categories of respondents and see if the way they are responding is significantly different, when comparing more than two categories of data it can produce some unexpected results. Therefore when doing analysis across more than two categories of data it is advisable to apply Tukey’s Correction, which is available in the Summary statistics tab of the Analysis Definition dialog.