Using the Chart Wizard
The Chart Wizard allows you to create new chart styles or amend an existing one based on a step by step process. You select a chart style, set the chart options, control the chart layout and specify chart and axis titles.
- The Chart Wizard is available in the Analysis Display window.
- Right-click the mouse or press F2 to display the context menu.
- Select the Chart Wizard menu to open the Chart Wizard.
- Use the buttons at the bottom of the dialog boxes to navigate through the Chart Wizard.
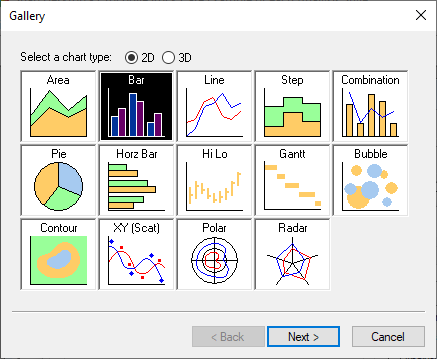
- The Gallery page allows you to select the type of chart you wish to design. Two buttons at the top of the box allow you to select either 2D or 3D chart types.
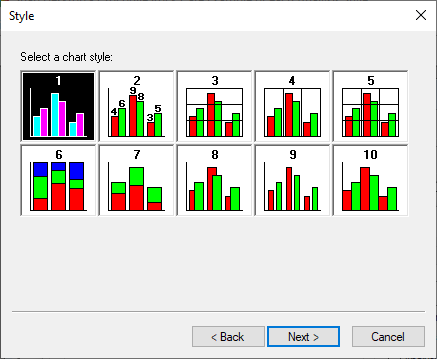
- Click Next to go to the Style page. This lets you set chart display options such as series labels, stacking and bar gap. The options shown will be different depending on the type of chart you are designing.
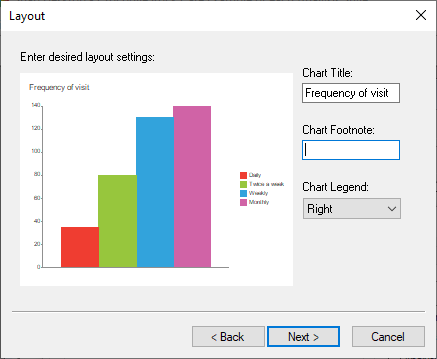
- Click Next to go to the Layout page, which provides options for selecting items such as chart titles, chart footnotes and chart legends. The preview image shows you how the chart will look with your settings.
- Click Next to go to the Axes page, which allows you to set axis titles.

- Click Finish to create your chart.