Showing mean values in a grid cross-tabulation
A grid cross-tabulation may be used to calculate the mean of a large number of variables broken down by the codes of one or more others. For example, in the Crocodile Rock Cafe survey it might be required to see how the mean service ratings differ between male and female respondents.
-
Click
 to open the Analysis Definition window to build a table.
- Specify the Analysis variables for the table or chart as Q6a TO Q6e (“How do you rate the following?”).
- Specify the Break as Q12 (gender).
- Select Means & Differences. Specify the Calculate variable/weight as Score5 (or another appropriate weight for the rating scale).
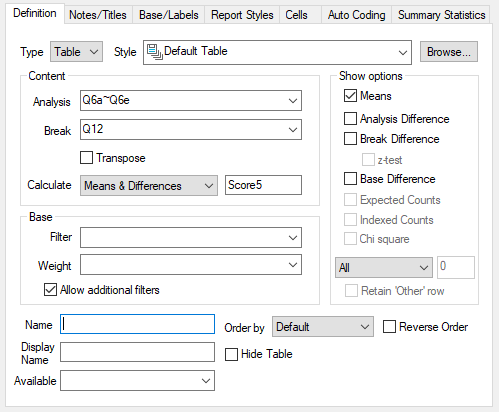
- Click OK to build the table.
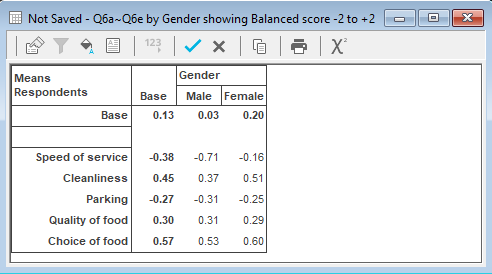
Each cell in the table shows the mean ratings of speed of service, cleanliness, etc., as calculated according to the values specified in Score5, both for the survey sample as a whole and for males and females separately. The various Analysis Difference, Break Difference and Base Difference options can all still be ticked.