Changing the lines between table rows and columns
The default style of an analysis table has lines around each cell of the table to create a boxed effect. Each of the regions of a table can be defined to include or exclude any of these lines. This is done using the Define Table Style dialog.
- Open the table to be changed
-
Click
 , click F2 or right-click to select Edit Styles from the context menu open the Define Table Style dialog.
- The Region field contains a list of all the areas of the table. Select one or more regions from the list.
- Change the color of the lines by clicking the Gridline button in the Colour section.
- To add or remove the lines of the selected regions click the lines in the Gridlines box.
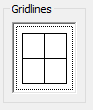
- To remove all lines, select all the regions of the table and remove all the lines displayed in the Gridlines area by clicking on each line.
-
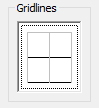
To only show lines between the data rows.
- First remove all lines as described above
- Select Body in the Regions pane
- Click the centre and bottom horizontal lines in the Gridlines area.
- Click Apply or OK to save the changes.